Pages

Monday 14 December 2015

Raster Suitability Model

Introduction and Goals: 

The final lab of this course will be to create a mine suitability model for Trempealeau County, Wisconsin. As has been previously stated in the labs, Trempealeau County, located in western Wisconsin located in a region very popular for frac sand mining. We will be looking specifically at the lower half of the county. This is primarily done so the geoprocessing processing takes a shorter amount of time.

Two models will be used: one to show where sand mining is suitable and the other to show where sand mining is risky. This index determines where it would be best to develop frac sand mines in Trempealeau County (figure 1). The goal is to create a final map which depicts the best locations for sand mining with minimal impacts to the environment and humans.

Figure 1. Study area for raster suitability model, located in Trempealeau County, Wisconsin.
Objectives:

Suitability for mining

Generate a spatial data layer to meet the criteria for:
1. Geology
2. Land Cover (suitable and non-suitable)
3. Proximity to Rail Terminal
4. Slope
5. Water-table depth

6. Then combine the criteria to develop a suitability index model

Risk for mining

Generate a spatial data layer to measure impacts to: 
1. Streams
2. Prime farmland
3. Residential and populated areas
4. Schools
5. Wildlife areas

6. Then combine the factors into a risk model
7. Examine the results in proximity to prime recreational areas

Methods and Results:

The work flow seen below (figure 2) developed the first suitability model. Some of the input feature classes that were originally vector needed to be changed from a feature to raster, this was done using the 'Feature to Raster' tool. The 'Euclidean Distance' tool created a distance to closest source raster. This tool basically serves as a 'Buffer' tool within raster. The 'Reclassify' tool was then run to rank the distance of the nominal variable as being suitable, or not suitable for frac sand mine location. The raster calculator was used to add the reclassified feature classes, which resulted in a suitability index.


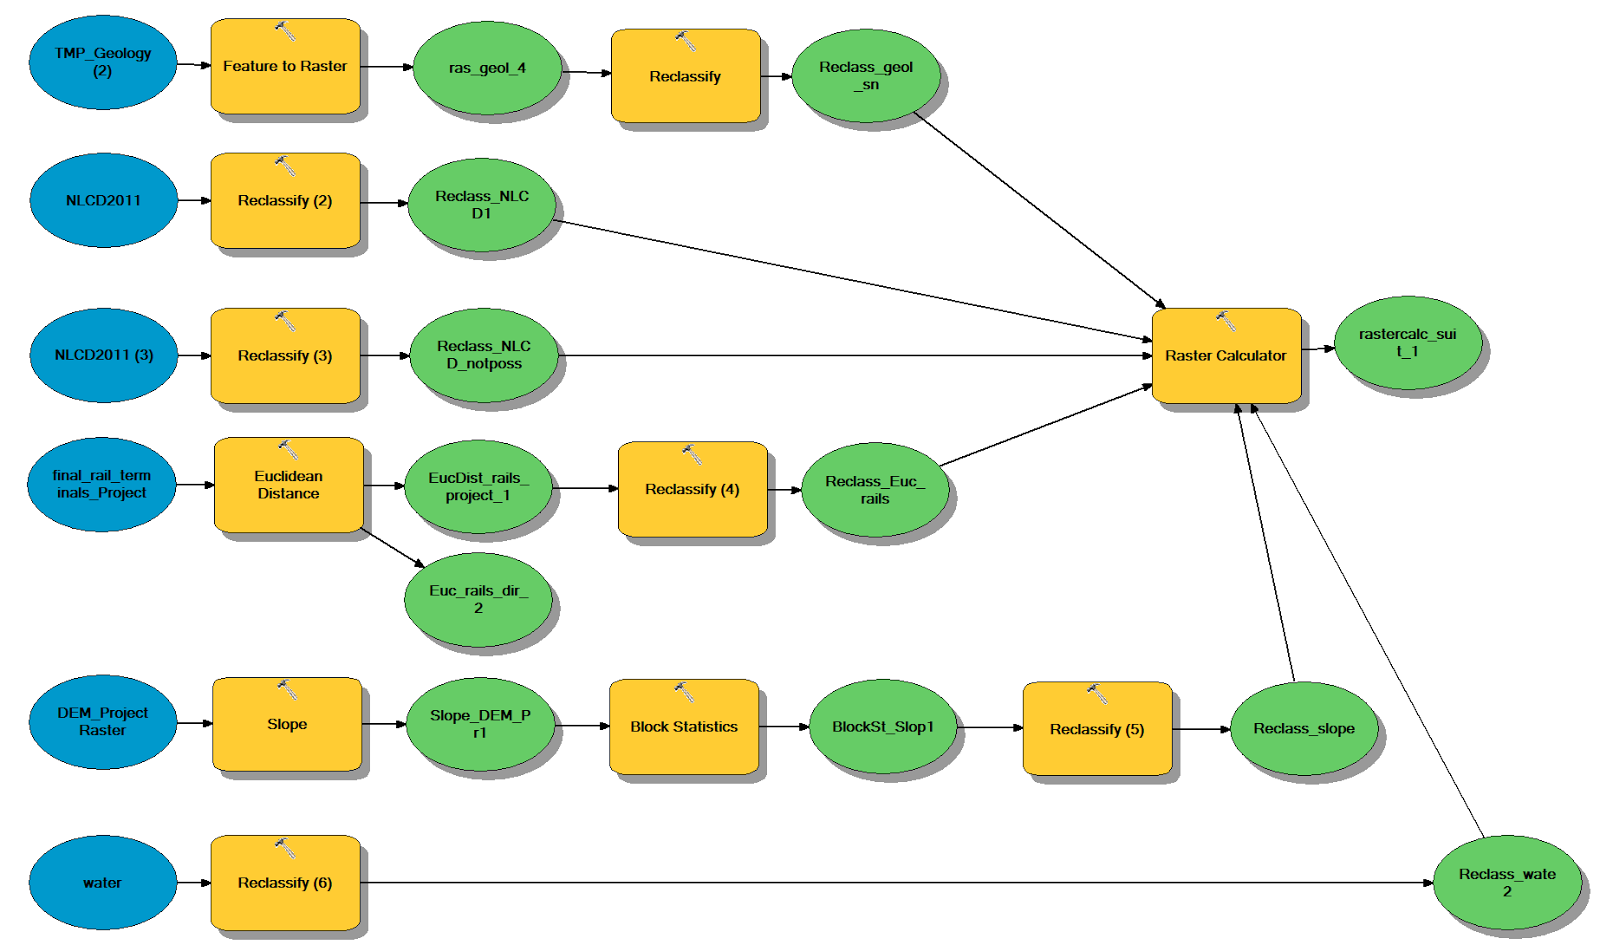
Figure 2. Workflow for the suitability model. The final tool 'added up' the suitability of  geology (suitable), land use (suitable), land use (not suitable), proximity to railroads, slope (suitable), and depth to water table (suitable). The raster were reclassified manually using the below parameters (see below in figure 3) to develop a single impact map (see below in figure 4).
As stated above, reclassification is vital in order to make the suitability model accurate. Below illustrates the classification that was manually inputted (figure 3) to create the most appropriate suitability model. The higher the ranking, the more suitable the area is for a mine site. The ranks labeled '0' are not at all suitable for a mine site.

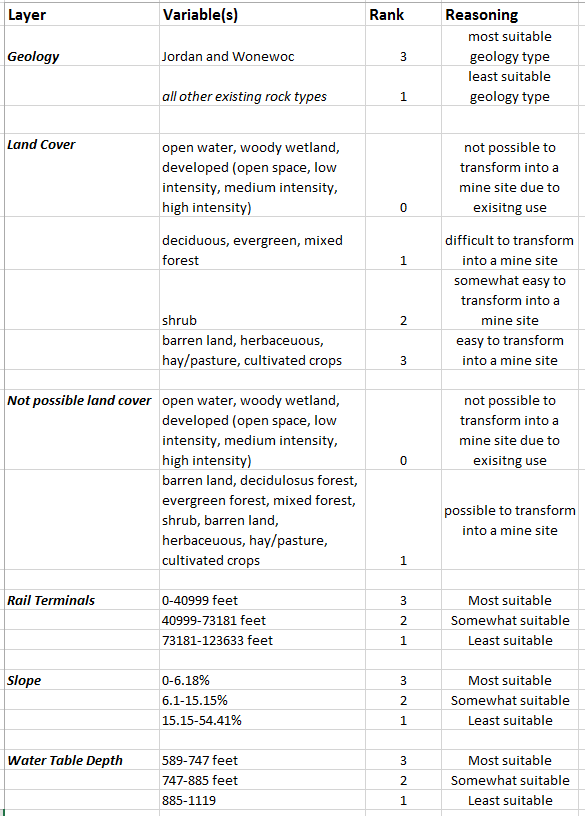
Figure 3. Reclassification of rasters for suitability model including geology, land use (suitable), land use (not possible), proximity to railroads, and slope (suitable).
The individual maps that were created from the reclassification are seen below (figure 4). The green areas on the maps were manually ranked the highest in the reclassification tool. The center top map (figure 4) was calculated using the 'Raster Calculator' tool to 'add up' the rasters. 
Figure 4. Mine suitability model maps. These maps depict locations where the land is most utilized for its resources.  
A very similar workflow was used on the impact model. The feature classes in the model include streams, prime farmland, residential areas, schools, and wildlife areas. The workflow can be seen below (figure 5).

Figure 5. Workflow for the mine impact model. The final tool 'added up' the impacts of the variables (streams, schools, residential areas, wildlife areas, and prime farmland). The raster were reclassified manually (as seen below in figure 6) to develop a single impact map (see below in figure 7).

The specific reclassification ranks that were assigned to the features (figure 6). Unlike the suitability model, a high rank was given to features that are the most impactful to the environment and people.Below illustrates the classification that was manually inputted (figure 6) to create the most appropriate impact model. The distances are all ranked similarly because the closer the mine is to the feature (ie streams and prime farmland), the more impacted the feature is.
Figure 6. Reclassification of rasters for impact model.

Figure 7. The red regions depict the areas that are impacted by mining the most, whereas the green areas indicate the least impacted areas for mining. The top center map is the impact model which took into account the impact that mining has on streams, schools, residential areas, wildlife areas, and prime farmland.

An additional analysis piece that was used during the lab was a weighted impact model. This was done through Py Scripter to determine a weighted index model using features of the previous impact model, with specific weight on the residential area, thus making that specific feature more 'important'. A weight of '1.5' was used to emphasize residential areas. The script for the lab can be seen here. A comparative map was created to show the difference between the weighted and regular impact models (figure 8).
Figure 8. Comparative model of the weighted and normal impact models. Note that the residential areas (the large squares), are seen as being more impacted in the weighted impact model than the normal impact model.
Another added component that was included for this lab was using the viewshed tool. This tool takes an observation point and calculates the estimated area that can be seen from the observation point using a digital elevation model (DEM).


Figure 9. Viewshed model. The output map for the viewshed tool is seen below in figure 10.
Figure 10. Viewshed tool map. 
The final set in completing the overall suitability model was using the raster calculator tool to 'add up' the calculated impact and calculated suitability features. The workflow can be seen below (figure 11). Its related map is also below (figure 12)
Figure 11. Workflow for the suitability and impact model. This model integrated all of the models created in this lab including the impact and suitability index.


Figure 12. Final suitability and impact model. The map depicts the location where is it best to mine in Trempealeau County while minimizing disturbances (such as streams and residential areas) and maximizing resources (such as depth to water table and proximity to nearest rail terminal). 

Conclusion:

As frac sand mining will likely become more popular as demand for the sand increases, it is important to develop accurate and relevant suitability models. Without the proper use of this GIS technology, there could be many implications that could leave the environment, people, and mining resources in jeopardy. Not only that, but the specific mining company that would hypothetically use our suitability model could lose millions of dollars from developing a mine on unsuitable land.

Discussion:

One of the most challenging components of creating the suitability model was creating a logical ranking for the reclassification. It is very easy to develop a random numbering system, but to make the project more accurate, it is important to consider logical breaks when reclassifying rasters. This takes someone who has a relatively expansive knowledge of the subject and how it should be applied in the real world.

Through trial and error throughout this lab, it is apparent that it is very easy to 'sway' the data depending on how the rasters are reclassified, however, it is very important to take time and consider the implications of a miscalculated impact or suitability model.

I personally really enjoyed this lab because it is extremely relevant to the real world and used a large number of the tools that I have gained over my two formal GIS courses. It is labs like this that get me excited to be able to use GIS as a took to make important environmental decisions in the future.

Source: 


Bureau of Transportation Statistics. (n.d.). Rail terminals feature class. Retrieved December 6, 2015, from http://www.rita.dot.gov/bts/sites/rita.dot.gov.bts/files/subject_areas/geographic_information_services/index.html 

Land Records. (n.d.). Trempealeau County Land Records. Geodatabase. Retrieved December 6, 2015, from http://www.tremplocounty.com/landrecords/ 

United States Geological Survey, National Map Viewer. National Land Cover Database (NLCD) raster and DEM. (n.d). Retrieved December 6, 2015, from http://nationalmap.gov/viewer.html

Wisconsin Geological and Natural History Survey (GNHS). Water table contours. GIS data. (n.d). Retrieved December 6, 2015, from http://wgnhs.uwex.edu/map-data/gis-data/

Wisconsin Geological and Natural History Survey (WGNHS). B.A. Brown, 1988. Bedrock Geology of Wisconsin, West-Central Sheet, WGNHS Map 104. Digitizing by Beatriz Vidru Linhares, University of Wisconsin Eau Claire (UWEC). Retrieved from UWEC GIS resources.

Thursday 19 November 2015

Network Analysis

Introduction:

An important component of the logistical side of mining is how and where to bring the sand once it is mined in order to ship it to the appropriate receivers. There are a few different ways to transport sand to the market, two of which are by railroad and via truck. Given that, we wanted to figure out which routes would be best for trucks to pick up the sand and deposit them to the nearest rail terminal which would ultimately bring the sand to the market.

In addition, trucks transporting frac sand to rail terminals take quite a toll on the public road system. This lab will help determine just how far trucks taking our routes travel as well as the hypothetical cost that is inhibited on each county due to frac sand truck transportation.

Methods:

In order to eliminate the mines for this project that already had a rail system in place, a Python script was run in order to determine which mines were greater than 1.5 kilometers away from a rail line. The script can be viewed here under 'Script #2'. This result ultimately leaves mines that do not use their own rail system to transport their mined sand. 

Once the mines without rail systems were selected, routes were developed using network analysis.Network analysis an extension of ESRI's ArcMap which serves as a GPS of sorts; it allows for individualized inputs and outputs to create a very specific routing plan. ArcMap has its own routing layer that contains all of the streets at the time the layer was created. For this project a specific routing tool called 'Closest Facility' was required. This allows the user to display the best routes between incidents and facilities. The 'facilities' for this lab were the rail terminals and the 'incidents' were the mines.

The routing was created in Model Builder. In addition other tools were used including the 'Project' tool to change the Geographic Coordinate System into a Projected Coordinate System. This gave us the ability to calculate the distance that it took to get from one side of a route to the other (because a GCS does not allow you to calculate surface distances). 

To gain an understanding of the cost that would be required for the trucks to transport the sand from mines to market, a calculation was done using a hypothetical scenario. The scenario was said that every route was traveled on 50 times per year (from the mine to the terminal and back) and the cost per truck mile was 2.2 cents. Be aware that the number calculated for this lab were hypothetical and by no means reflect the actual cost of trucking sand to and from mine sites. Below is the data flow (figure 1) that was used to find the closest facility routes, change the projection, and add/calculate fields in order to determine the distance of each counties routes. To break the distance down to the county level, the summary tool was used. The distance that was determined for these counties was then applied to the cost calculation and the table seen below is the output of the data flow model (figure 2).
Figure 1. Data flow of the entire process from determining facilities to calculating both the miles and cost fields. The output resulted in routes from the mines to the rail terminals, and two additional field calculations.  

Figure 2. The output table after Model Builder was successfully 'run'. The 'calc_miles'  field reflects the length of the trucking routes in each county by mile. The 'calc_cost' field reflects the result of the cost that trucks have on the roads systems at the county level. 
Results:

The results of the routing and cost analysis that were conducted from the data flow are shown below (figures 3 and 4).
Figure 3. The final map showing the routes that truck should take from the mines to the terminals for the sand to be shipped.

Figure 4. Cost Analysis map which depicts the cost that is inhibited from trucking sand to market by each county. The counties in grey were not calculated for their maintenance cost because no routes were created in those counties.

Conclusion:

The process of figuring out the routes for trucks as well as their mileage calculation is no easy task. In addition to that, the shear cost of mining on a county is not just the potential environmental hazards, but also the monetary cost of using the public roads system for the benefits of a private industry. Below is the cost to each county based on the amount and distance that trucks carrying sand inhibit largely on taxpayer dollars (figure 5).

Figure 5. Graph depicting the cost of trucking sand from the mines to the terminals and back to the mines. The number that was used for this calculation was the hypothetical number of 50 truck trips per year per route with the cost of trucking the sanding being .022 cents/mile.
I had never considered weight to be a factor in the cost of frac sand mining impacts. This brings the question: who pays for the cost of the roads system? Is it a tax specific to frac sand mining companies? This issue has implications on the ethics of using public road systems in order to bring goods to the market. This issue is extensively studied in a case study of Chippewa County's frac sand mining transportation impacts which is found here.

Discussion:

We discussed in class that some people have businesses just to serve as a routing developers. I now understand why, because the amount of precision and detail that is required to accurately measure roads and addresses is incomprehensible. Even the ESRI street routing layer that we used was out of date, and that is not a cheap ESRI extension.

I noticed in my cost map that there was no route created in the very northwestern counties. The first map has the route because it was calculated outside of Model Builder. A parameter set in Model Builder that was different than the original route that I calculated was that I intersected the state of Wisconsin with the routes, which eliminated the routes outside of the state. Had the route been executed correctly, the cost in those counties would have been much higher because of the long distance that the sand needed to travel in order to get to market (see figure 3).

Sources: 

Wisconsin Department of Natural Resources. (n.d.). Retrieved November 8, 2015, from http://dnr.wi.gov

Network Dataset analysis was calculated based on ESRI Street Map USA.

Transportation Impacts of Frac Sand Mining in the MAFC Region: Chippewa County Case Study. (2013). Retrieved November 20, 2015, from http://midamericafreight.org/wp-content/uploads/FracSandWhitePaperDRAFT.pdf 


Friday 6 November 2015

Geocoding Frac Sand Mines in Wisconsin

 Goals and objectives

This lab will serve as a continuation of the previous frac sand mining lab. In the previous lab, spatial data was collated for Trempealeau County, Wisconsin. This lab will take raw mine address information via an Excel Spreadsheet and transform it into a map so that the mines can be spatially analyzed for sand mining suitability in subsequent labs, which will be done through the process of geocoding. After geocoding, we will compare our results to our peers and the precise locations (provided by our professor).

The objectives are listed below (figure 1).

Figure 1. Geocoding lab objectives.


Methods

Many steps have to be completed in order to properly geocode. The data that we received in Excel from the DNR was quite messy and the data was not normalized (figure 2). In order to normalize the data we needed to separate the location information into different cells containing: address, city, state, zip code and unique mine ID (figure 3).

Figure 2. Non normalized data in Excel. Note that the address column contains PLSS information as well as the zip code, city, and other information. 

Figure 3. The normalized output table, which was then exported to ArcMap for geocoding.

The data provided for the lab was distributed by the Wisconsin Department of Natural Resources (DNR). Much of the data that they receive from the mines is sporadic and we received that data directly. Some of the locations included the address, city, and zip code and we could easily find the location of the mine; however, other contained only the PLSS. PLSS is the Public Land Survey System (figure 4), which is the grid system that Wisconsin, and much of the United States, has based their land descriptions on. This is why there appears to be a grid-like pattern on aerial imagery (figure 5).

Figure 4. PLSS grid. If the mine sites were given without an address, they instead had a PLSS. The image depicts how  to read a PLSS.(http://geology.isu.edu/geostac/Field_Exercise/topomaps/plss.htm)
Figure 5. Aerial imagery of farmland. Note the grid-like patches that are derived from the PLSS.
http://oklahomafarmreport.com/wire/news/2012/11/media/05086_FarmAerialView06282012.jpg
Once the Excel table was normalized, it was brought in to ArcMap and the Geocoding Extension was turned on. The ESRI address database could then match all potential addresses. 14 of my 19 addresses were found and 5 were unable to be found. Of the ones that were found, the locations were verified by locating each address in ArcMap. If the address point was 'off', then a new point could be created to make the location accurate.

The reason why some could not be found was due to ESRI's inability to find locations based on PLSS data when address information could not provided. Without a hint of where the addresses were located, we needed to turn to the PLSS shapefiles containing all of the information required to locate the PLSS mines. Some PLSS descriptions were straightforward, however some of them gave multiple PLSS descriptions, which made it more difficult to find the exact location of the mine. To attempt to combat this, I looked up the names of the mines to see if their relative locations could be determined using Google Earth, I could then hopefully narrow down the mine location.

In the end of my geocoding, I kept only 3 of the address markers that ESRI found in the initial stages of geocoding. Although many of them were near the mine locations, they were often far away from the road, which is less accurate for the information required in the future.

Once all of the geocoding was complete, I compared my results to my classmates and my professor's exact mine addresses. Organizing the mines to do this was tricky, as there were four other peers that had my mines. To combine their data into one shape file, I went into the attribute table and selected the mines that I was given to geocode and subsequently created a new layer from the selected features. The reasoning for doing such was to be able to sift through less mine locations than if I had performed a merge of all of my peer's mine sites, which would have included mines that I had not geocoded. Another element of inconvenience was that we all named our 'unique mine ID' field a different alias name. Without the same naming scheme, it makes it initially impossible to merge the data. This required creating new fields in each of my peer's attribute tables. In addition, all of the shape files needed to be projected into a projected coordinate system instead of a geographic coordinate system in order to be able to calculate the distance in measureable lengths, not degrees.

The 'merge' tool was then used to create one shape file with my peer's mine information. To determine how accurate my geocoding was comparatively to my peers and the exact locations provided by my professor, I used the 'Point Distance' Tool.

 Results

As expected, my mine locations were 'off' comparatively to the actual mine locations. Below figures 6 and 7 show the output tables after running the 'Point Distance' tool. The distance calculated was in meters.

Figure 6. This was the output table from the point distance tool. The distance shown is in meters shows how far the actual mine location was in comparison to the mines I geocoded. The average error distance was 3,756 meters from my mine sites to the actual mine sites.

Figure 7. The output table from the point distance tool. This comparison was between me and my peer's mine locations. Due to missing mines from some of my peers, I could only show the distance between 13 of the 19 mines.

Below figures 8-10 are the maps for the locations of the mines that I found as well as the actual mines and my peer's mines.

Figure 8. The location of the mines I geocoded and the actual locations of the mines. Overall, my locations were fairly close to the actual mine locations.
Figure 9. My mines in comparison to my peer's. They were mostly spot on, which is a relief to know that the locations that I found were very similar to my peers.
Figure 10. All of the mines that were compared in the process of geocoding.
Discussion

In the end I had a larger mean error with the actual data from the DNR at a distance of 3,756 meters whereas my error mean distance with my peers was 1,030 meters. One of this issues with the number with my peers is that I only had 13 of the 19 mines to compare the distance to because some of my peers did not post their mines to ArcMap. The errors largely in part came from issues in the data automation and compilation areas which included digitizing (or geocoding). This is because geocoding (if you choose to use the points found from the geocoder) finds its addresses generally by estimation, not a precise location. In addition, anyone adding points manually will not have the same points as someone else, so even the 'correct' points could be wrong technically.

Additionally, attribute data input, an error type, could have been incorrect by the DNR or the people that they received the information from. This is very likely considering that the data provided was sporadic and sometimes difficult to understand.

We can know which points are correct by having the lat/long data from the DNR. The majority of the time lat/long data is a fool-proof way of figuring out a particular address location. However, another error type, field survey measurements, could have initially calculated the lat/long data incorrectly, thus giving an incorrect location.

Conclusion

The process of  geocoding is extremely helpful in a spatial analysis, and without it, one would lose accuracy Using geocoding is never precise, especially when one has to manually add the points. This shows that there has to be some consideration when looking at a map for accuracy, which is exactly why it is so important to include the data source as well as the metadata. In addition, some of the data points that were given from the 'correct' mine locations was actually centralized on the mine itself without consideration of the closeness to the road, which is what we were suggested to do for this lab. Basically, you have to take geocoding as a relative form of locating addresses.

Sources
Wisconsin Department of Natural Resources. (n.d.). Retrieved November 8, 2015, from http://dnr.wi.gov

PLSS - Legal Descriptions | PLSS. (n.d.). Retrieved November 8, 2015, from http://www.sco.wisc.edu/plss/legal-descriptions.html 


Friday 23 October 2015

Data Gathering and Preparation for Frac Sand Mining Suitability Project

Goals and Objectives:

The goal of this project was to be able to download data for Trempealeau County, Wisconsin to obtain various types of data to be able to spatially analyze the effect that frac sand mining has on the county's environment. The task was then to be able to display the raw data in a form in which a Python script could read and process the data to create map outputs of the county data for railroads, soils, land cover, cropland, and elevation. This county was chosen for the assignment because of its proximity to frac sand mining. In addition, frac sand mining is heavily affecting counties surrounding Eau Claire, and its presence in the news is a constant reminder of its conflicting benefits and detriments to people and the environment.


Methods

Data for this lab were extracted from various online sources (figure 1). 


Figure 1. Online sources used for Trempealeau County.
Some of the websites required a box to be drawn around the desired study area, whereas other websites allowed the user to specify the study area based on county. All of these .zip files were downloaded to a folder and unzipped into a 'working' folder to separate the 'zipped' and 'unzipped' files, which ultimately reduced the file size.  Below is the work flow from beginning up until the point of need to use Python scripter of the preliminary project (figure 2). 
Figure 2. Work flow from beginning until needing to work in Python scripter. After the redundant information was deleted, maps were made in ArcMap.

Once the data was downloaded into the geodatabase the data could then be brought in to Python, a programming language (see the 'Python' tab at the top of the blog page). This gave an easy way to convert all of the data obtained from the online sources . Using Python can alleviate many headaches when processing large amounts of data. In the case of the preliminary project, the rasters from the geodatabase needed to be projected to the local projection, NAD83 HARN WISCRS Trempealeau County Feet and then be clipped to the county and extracted to the geodatabase (figure 3).


Figure 3. The project and clip/extract steps were done in this project using Python. 
A collection of maps were then created from the extracted raster files. It was a simple process after the script was all said and done (figure 4).

Figure 4. Various topographic maps of Trempealeau County, Wisconsin. The maps will be used in later labs to create a suitability model for frac sand mining sites in the county.

Data Accuracy:

A vital, yet often overlooked piece of the data collection puzzle is being aware of the data accuracy.This entails the nitty gritty of metadata which is the description of the content of the data. Metadata should include the following:


Scale: The ratio or relationship between a distance or area on a map and the corresponding distance or area on the ground, commonly expressed as a fraction or ration.

Effective Resolution: The appropriate detail in which a map depicts the location and shape of geographic features. If the map is small scale, the resolution is bigger. Thus meaning that the pixels will be bigger as well. This eliminates the need for unnecessary storage of extra pixels (figure 5).

Minimum Mapping Unit: A value that represents the smallest depictable or plotable object. This directly correlates with the effective resolution of a map (figure 5).

Figure 5. Table for the appropriate resolution for a select set of map scales. Note, Raster Resolution and Effective Resolution are synonymous.

Lineage: It is the documentation of the source materials from which a specific set of geographic data was derived. This helps the user keep track of who has altered the database. If there were to be an error in the data, it could be traced back to see where the error occurred.

Temporal Accuracy:A measure of data quality with respect to the representation of time in geographic databases, or basically how updated a source's data is.

Attribute Accuracy: The precision of the attribute database linked to the map's features.The more accurate the attribute data, the better the data source is to use.

A table was created to depict the data accuracy of the data obtained online (figure 6).
Figure 6. Data accuracy table of Trempealeau County datasets obtain from various online sources.


Conclusions:

There are a few specific concepts to be aware of when using datasets from different sources. As reflected in the data accuracy table (figure 4), all aspects of data vary in how updated they are, the attribute accuracy, resolution etc. These aspects effect how well and accurately the data is when put together in a map, much like the one created in this preliminary lab. Industry standards have attempted to keep the level of attribute accuracy (see ASPRS for industry standards) at a high level to maintain data integrity, but there are still some organizations that fail to include that vital information in the Metadata. This makes it difficult to use a data source when one is unaware of its accuracy, which then discredits these organization's data.

Thursday 22 October 2015

Sand Mining in Western Wisconsin Overview

What is sand frac mining and where is it in Wisconsin?

Frac sand is a silica sand (also known as quartz) whose characteristics include well sorted sand grains that are extremely hard and very well rounded (figure 1).

Figure 1. Individual grains of silica sand shown with a penny for scale. Not how well sorted and rounded the grains are.

The sand is found largely in Western Wisconsin, which is the primary area of the state which was unglaciated during the last Ice Age (figure 2).


Figure 2. The primary area in which frac sand mining occurs in the state of Wisconsin are located in sandstone geologic regions. The mines themselves are grouped primarily in western portion of the state (red squares show mine sites in 2013).


Frac sand mining has been in Wisconsin for the last 40 years, but has rapidly increased in production because of the booming petroleum industry (figure 3). Wisconsin alone holds more than 75% of the country's revenue for frac sand mining and there are 129 industrial sand facilities, 85 of which are still in operation. The sand is then used for hydraulic fracturing of natural gas all around the world.


Figure 3. There has been a boom in frac sand mining in Wisconsin, which has given the state an economic boost in the industry. The industry was worried that a drop in the price of oil would reduce demand for the mining, but that has yet to be seen in the state.


Hydraulic fracturing begins when a well is created that is hundreds to thousands of feet deep. In order to obtain gases and the like, water must be injected into the well at an extremely high pressure. This pressure causes fracturing to occur in the rock, thus allowing companies to extract the gas from the pockets that they hope to 'fracture' into (figure 4).


Figure 4. Diagram of how frac sand is used to extract gas. The sand, water and other chemicals are pumped below the groundwater at a very high pressure, which then opens weak points in the rock hundreds of feet below the surface. The newly created fractures access the pockets of gas, which can then be brought to the surface.

What's the problem with sand frac mining in Western Wisconsin?

Citizens of frac sand mining areas are concerned for their health and well being. One of the issues with this mining is the release of airborne particulate matter (figure 5). This matter in the form of silica dust finds its way into human lungs, which has been found to cause cancer and respiratory issues that lead to illness and even death.


Figure 5. An aerial view of the surface impact that frac sand mining has on the land. The particulates unearthed in the process of mining are exposed at mines like this one.


In Wisconsin there are very few regulations regarding air, water, and groundwater controls on mining of frac sand. The water use for sand mining ranges from 420,500 to 2 million gallons of water per day. This extreme water use is unsustainable for the current human population, in addition to the biological strain this places on the natural environment.

GIS Application for the Frac Sand Industry

GIS is a primary tool in identifying and solving issues such as frac sand mining in the area. We will use various data sets to answer questions regarding the components of Trempealeau county's make up including land use/land cover, cropland, railroads, and digital elevation models. In the semester, ArcGIS will be used to create a suitability and risk model for frac sand mining in western Wisconsin, and more specifically Trempealeau County. These databases will be obtained from governmental organizations including USGS, SSURGO, USDA, and the Trempealeau County geodatabase.


Works Cited: