Introduction:
An important component of the logistical side of mining is how and where to bring the sand once it is mined in order to ship it to the appropriate receivers. There are a few different ways to transport sand to the market, two of which are by railroad and via truck. Given that, we wanted to figure out which routes would be best for trucks to pick up the sand and deposit them to the nearest rail terminal which would ultimately bring the sand to the market.
In addition, trucks transporting frac sand to rail terminals take quite a toll on the public road system. This lab will help determine just how far trucks taking our routes travel as well as the hypothetical cost that is inhibited on each county due to frac sand truck transportation.
Methods:
In order to eliminate the mines for this project that already had a rail system in place, a Python script was run in order to determine which mines were greater than 1.5 kilometers away from a rail line. The script can be viewed here under 'Script #2'. This result ultimately leaves mines that do not use their own rail system to transport their mined sand.
Once the mines without rail systems were selected, routes were developed using network analysis.Network analysis an extension of ESRI's ArcMap which serves as a GPS of sorts; it allows for individualized inputs and outputs to create a very specific routing plan. ArcMap has its own routing layer that contains all of the streets at the time the layer was created. For this project a specific routing tool called 'Closest Facility' was required. This allows the user to display the best routes between incidents and facilities. The 'facilities' for this lab were the rail terminals and the 'incidents' were the mines.
The routing was created in Model Builder. In addition other tools were used including the 'Project' tool to change the Geographic Coordinate System into a Projected Coordinate System. This gave us the ability to calculate the distance that it took to get from one side of a route to the other (because a GCS does not allow you to calculate surface distances).
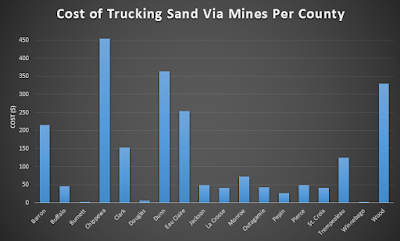
To gain an understanding of the cost that would be required for the trucks to transport the sand from mines to market, a calculation was done using a hypothetical scenario. The scenario was said that every route was traveled on 50 times per year (from the mine to the terminal and back) and the cost per truck mile was 2.2 cents. Be aware that the number calculated for this lab were hypothetical and by no means reflect the actual cost of trucking sand to and from mine sites. Below is the data flow (figure 1) that was used to find the closest facility routes, change the projection, and add/calculate fields in order to determine the distance of each counties routes. To break the distance down to the county level, the summary tool was used. The distance that was determined for these counties was then applied to the cost calculation and the table seen below is the output of the data flow model (figure 2).
The results of the routing and cost analysis that were conducted from the data flow are shown below (figures 3 and 4).
 |
| Figure 3. The final map showing the routes that truck should take from the mines to the terminals for the sand to be shipped. |
Conclusion:
The process of figuring out the routes for trucks as well as their mileage calculation is no easy task. In addition to that, the shear cost of mining on a county is not just the potential environmental hazards, but also the monetary cost of using the public roads system for the benefits of a private industry. Below is the cost to each county based on the amount and distance that trucks carrying sand inhibit largely on taxpayer dollars (figure 5).
I had never considered weight to be a factor in the cost of frac sand mining impacts. This brings the question: who pays for the cost of the roads system? Is it a tax specific to frac sand mining companies? This issue has implications on the ethics of using public road systems in order to bring goods to the market. This issue is extensively studied in a case study of Chippewa County's frac sand mining transportation impacts which is found here.
Discussion:
We discussed in class that some people have businesses just to serve as a routing developers. I now understand why, because the amount of precision and detail that is required to accurately measure roads and addresses is incomprehensible. Even the ESRI street routing layer that we used was out of date, and that is not a cheap ESRI extension.
I noticed in my cost map that there was no route created in the very northwestern counties. The first map has the route because it was calculated outside of Model Builder. A parameter set in Model Builder that was different than the original route that I calculated was that I intersected the state of Wisconsin with the routes, which eliminated the routes outside of the state. Had the route been executed correctly, the cost in those counties would have been much higher because of the long distance that the sand needed to travel in order to get to market (see figure 3).
Sources:
Wisconsin Department of Natural Resources. (n.d.). Retrieved November 8, 2015, from http://dnr.wi.gov
Network Dataset analysis was calculated based on ESRI Street Map USA.
Transportation Impacts of Frac Sand Mining in the MAFC Region: Chippewa County Case Study. (2013). Retrieved November 20, 2015, from http://midamericafreight.org/wp-content/uploads/FracSandWhitePaperDRAFT.pdf


No comments:
Post a Comment